
By Jo Muller
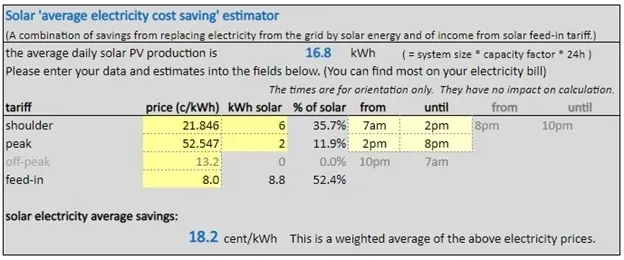
As mentioned in part 1 of this article, the estimation of the third value (the savings on electricity) is a bit complicated to determine. It comprises the estimated savings in shoulder and peak period and the income from the feed-in tariff for feeding solar electricity back into the grid. For that purpose, there is a little helper available. Just use the one below or you can also find it by scrolling down inside the solar calculator.
You need to enter your electricity cost per cent per kWh including GST for the shoulder and peak period. If you have a flat rate, just enter the same value twice. The rates can be found on your electricity bill. Also enter what you get paid for solar (the feed-in tariff). This may get a bit tricky depending on the electricity retailer you are with. Some are now restricting the amount of electricity per day they are willing to pay for. Use common sense and make the necessary adjustments. Then you need to make an educated guess about the energy replacing the grid electricity. The unit for this is kWh (kilo watt hour). On most electricity bills you can find information of the average electricity consumption for a day for the ‘shoulder’ and for the ‘peak’ period. If there is no information for the daily average on the electricity bill, you can use the data for the full billing period and divide by the days of the billing period.
For a start assume that you can replace 70% of that by solar energy and enter the corresponding values into the calculator under kWh solar.
Example:
· If your average daily consumption during the peak period is 9 kWh, then your guess for solar is 9 kwh * 70% = 6.3 kWh. You enter 6.3 under ‘kWh solar’ in the line for ‘peak’.
· Do the same procedure for ‘shoulder’.
· The value for solar will be calculated automatically.
This may have to be adjusted if you install a solar PV system of a size that is much larger or much smaller than your energy consumption. For instance, very large or very small systems need adjustments for the percentage because the small systems will not generate the amount of solar energy and very large systems may produce more energy than your retailer is willing to purchase from you.
You then use the resulting value for ‘solar electricity average savings’ (in the example 18.2 cent/kWh) and enter it in the third field ‘savings on electricity’ in the solar calculator.
If you want to adjust the calculation more to your situation you can scroll to the right in the spreadsheet and modify the orange fields. The description will tell you what the individual data mean.
You can for instance adjust the value for the life of the inverter or add some annual cost, either as a fixed cost per year or as a cost proportional to the size of the system.
As you enter the data you can see how the results are changing.
In addition to the comparison rate (IRR), you can see the accumulated cash flow (not corrected for time value of money) and the net present value (NPV) which is essentially the accumulated cash flow with a correction for the time value of money. Or in other words the NPV is the accumulated cash flow in today’s money.
Another way to describe the investment quality of a solar PV system is to calculate the levelised cost of energy (LCOE). The LOCE is the production cost of electricity after all components have been taken into account. If the owner sells electricity at the LCOE value, he will just break even at the end of the project. A higher price for electricity than the LCOE will lead to a financial gain, a lower price will lead to a financial loss.
Both IRR and LCOE take the time value of money into account. That means that because of inflation and interest rates, the $100 that I have in my hand today have a higher value than $100 which I will get at a later date. In order to calculate this, the formula for LCOE needs know the discount rate. The discount rate is something like an interest rate and can be different if you pay for the investment in cash or with a loan. It is set to a default value of 7%. It can be changed by entering a different value in the last orange field.
The value for the first orange field is an interesting value. This is the so called ‘capacity factor. The capacity factor for solar panels in the Sydney area has been determined with long term data and is roughly between 14% and 16%. This includes already the reduction caused by suboptimal orientation of the solar panels. The capacity factor is a way of describing how much energy the panels are creating on average per day in regard of their nominal capacity. For example, a 300 W solar panel will produce
700W * 24 h/day * 365 days/year * 14% (capacity factor) = 367.920 W/year = 368 kW/year
The calculator does not take taxes and depreciation in consideration. (The bank also does not tell you the interest rate after tax, but before tax.) However, if you want to include the inflation rate you can do that by modifying the annual increase of the cost of electricity and the discount rate.
Final comments
What about batteries? – Just wait for my next article.
Do not worry too much about getting the absolute correct value for the results. The calculator is only meant as a guide not as a precision tool. Also, you can change the data any time and you will get an instant change in the results. Besides, as you can see, the financial returns of a solar PV system are so much superior to any other safe investment that a mild deviation of the results, caused by some unprecise data and assumptions, does not really matter.