By Jo Muller
In my first article I showed that using the comparison rate is a much better method for comparing an investment in solar PV system than just using the payback period. (The ‘PV’ in solar PV stands for photovoltaic which means making electricity from light.) The comparison rate is calculated as Internal Rate of Return (IRR) and this rate gives you a percent value comparable to the interest rate on a bank account. This includes getting your money back at the end of the term.
Let’s look at this using a specific example. The calculator below is designed to calculate all relevant financial data requiring just 3 specific values as input from you. We will go through this quickly first by using some assumptions.
Before I go ahead, I need to declare that while all information here has been prepared and compiled with great care, it is provided as reference only. However, this article is not legal, financial nor professional technical advice and I am not liable for any negative consequences resulting from the use of this information.
The calculator above is a spreadsheet that calculates the key financial figures for an investment in solar PV. It does not take taxes and depreciation in consideration. This is the same as with a bank, which also does not tell you the interest rate after tax.
The calculator uses some simplifications to be as user-friendly as possible. It requires only an input in the first three yellow fields. For higher accuracy there is also the option to scroll to the right and change the data in the orange fields. However, these data have already been set to default values which only need to be changed in specific circumstances. We will get back to those at the end of the article.
Entering the data
The value to enter into the first yellow field is the capacity of the system in kW. For some solar PV installations, the total capacity of the panels can be higher than the rated capacity of the inverter. In that case taking the average of the two values should be about right. But if you want to stay on the conservative side, just enter the lower value into the calculator.
The value in the second yellow field is the complete price of the solar PV system including GST. You also need to include all other costs that are related to the project, like installing a new meter. Some solar installers do not include this in the cost of the installation because they may not employ an electrician with the special license to install electricity meters (class 2 license).
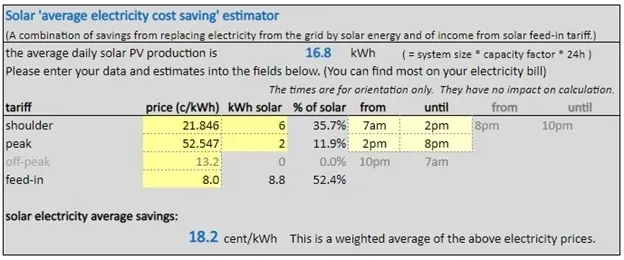
Finding the value for the third yellow field is the most difficult. It is an estimate of the average price of the saved energy as well as the feed-in tariff for exporting ‘solar electricity’ back into the grid. In the first round of calculation, you may save you all the hassle and enter a quite conservative number like 18 cent/kWh.
The correct value for your system will most likely be better if you replace a significant amount of your grid electricity with solar energy. You can check that out later.
After you have entered these three values, you will see an instant result.
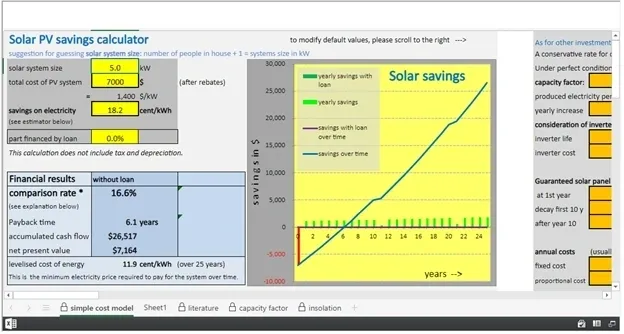
For instance, you can type in 6 kW tor the system size and $6000 as cost. This is assuming a kind of an average price of $1000 per kW system size. There are both cheaper and more expensive systems in the market. And the you enter the afore mentioned 18 cent/kWh for ‘savings on electricity’.
Results
This will give you 23.1% comparison rate. This is huge, if you compare what you get from the bank for investing your savings!
The chart shows in a graphical way what is going on:
On the vertical axes is the money axis and the horizontal axis shows the time scale in years.
The read bar on the left represents the money spent ($6000 in the example).
The small green bars represent the annual savings, including the income from selling electricity back into the grid.
The blue line is showing the accumulated savings over time. You can see two bumps in the blue line. This is caused by the calculator assuming that every 10 years a replacement or repair for the inverter will be required.
There are some more interesting observations: The point where the blue line is crossing the time axis is when the system has paid for itself (4.5 years in the example): the payback period or payback time.
And as you can see on the chart, your accumulated savings + income from solar does not stop there, but it keeps going for the life time of the solar panels, resulting in a total of $34,471 after 25 years. Not a bad deal from investing $6000.
And it gets even better:
Financing the solar PV system with a loan
Entering a value in the fourth yellow field is required if you finance your solar PV system with a loan. Just enter 100%. As you can see this will also give you the option to enter interest rate and time of the loan.
And there will be instant changes if you use this loan:
The payback period is 0 (zero) years, because you never put in your own money and the savings from solar will pay for the loan and more.
The comparison rate is infinite! As you put in nothing of your own money, every return is just an extra.
The value for the accumulated savings in the case of a loan are a bit smaller, but not that much. Instead of a total of $34,471 we end up with a total of $32.319 which is hardly any worse!
This will also help people to invest into a solar PV system on their roof, even if they have a problem with their day-to-day cash flow. Money does not grow on trees but loans for solar systems are available a low interest rates from some banks (ask for green loans). An even better option is to use a redraw of the mortgage if the mortgage on the home has not yet been paid off. This will provide the money for the solar investment at extremely low interest rates.
Impact of shading
Given that the financial return of a solar PV system can be multiple times better than the return form a savings account, some amount of shading of the solar panels can be tolerated. If we assume that the output of the solar panels in the above example is reduced by 50% due to shading, the comparison rate will be roughly reduced to half. You can simulate this by reducing the size of the system and not changing the cost.
In the former example a system with an output reduced by 50% from 6 kW to 3 kW would still provide a comparison rate of 11%. This is still far more than any interest rate on a savings account and makes it a worthwhile investment.
WHAT YOU CAN DO
· Use this calculator to get an idea about the financial impact of purchasing a solar PV system.
· Double check the outcome of this calculator by comparing it with other solar calculators and/or by getting professional advice.
· And if you are happy with the numbers, act on it and put solar panels on your roof. This will not only help the environment but also your hip pocket.